

(Kitco News) – The ramping up of “Cold War 2.0” between China, Russia, Iran, and North Korea against the United States and its allies is a big reason why gold will likely outperform the broader metals complex in the second half of 2024, but there are plenty of other indicators which also support this view, according to Mike McGlone, Senior Commodity Strategist at Bloomberg Intelligence.
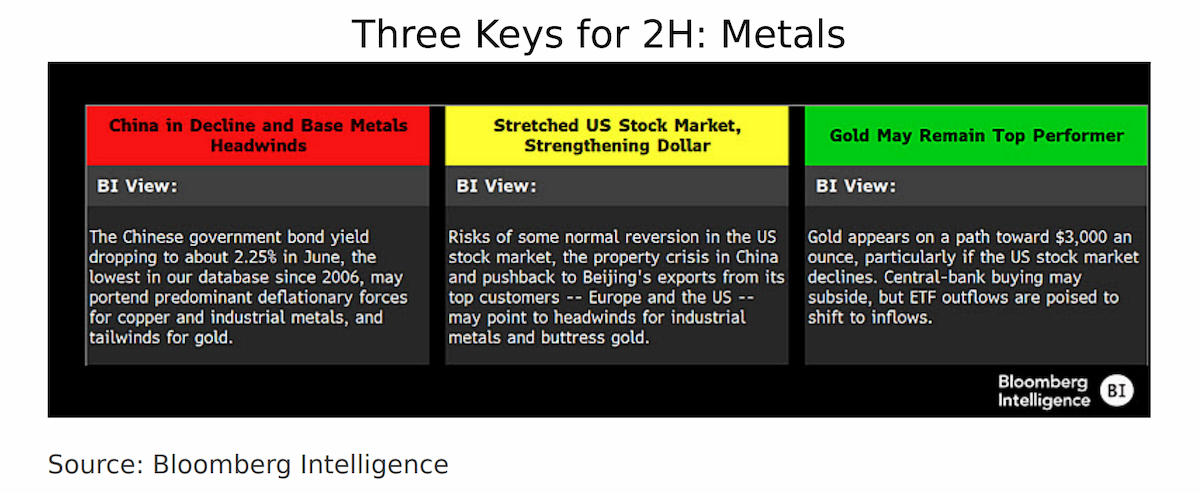
“That copper made a new high in 1H and crude oil didn't may show the tilt of the metal outperforming the fossil fuel in the longer term,” McGlone wrote in his Midyear Metals Outlook on Tuesday. “Yet gold appears to have the upper hand vs. most commodities in 2H. If the US stock market can stay on a tear – the S&P 500 total return is about 16% in 1H to June 24 – base metals should remain buoyant. Risks of some normal reversion in beta appear elevated, with tailwind implications for gold.”
He added that China's property crisis and growing resistance to its exports are showing in the country's 10-year yield falling to 2.25%, its lowest level since 2006. “The "unlimited friendship" between the leaders of Russia and China may have shifted the global order, with gold in the middle,” he said. “We see the precious metal continuing to advance in 2H.”
McGlone also pointed to other correlations that appear very positive for gold prices, even as they predict negative performance for the broader economy.
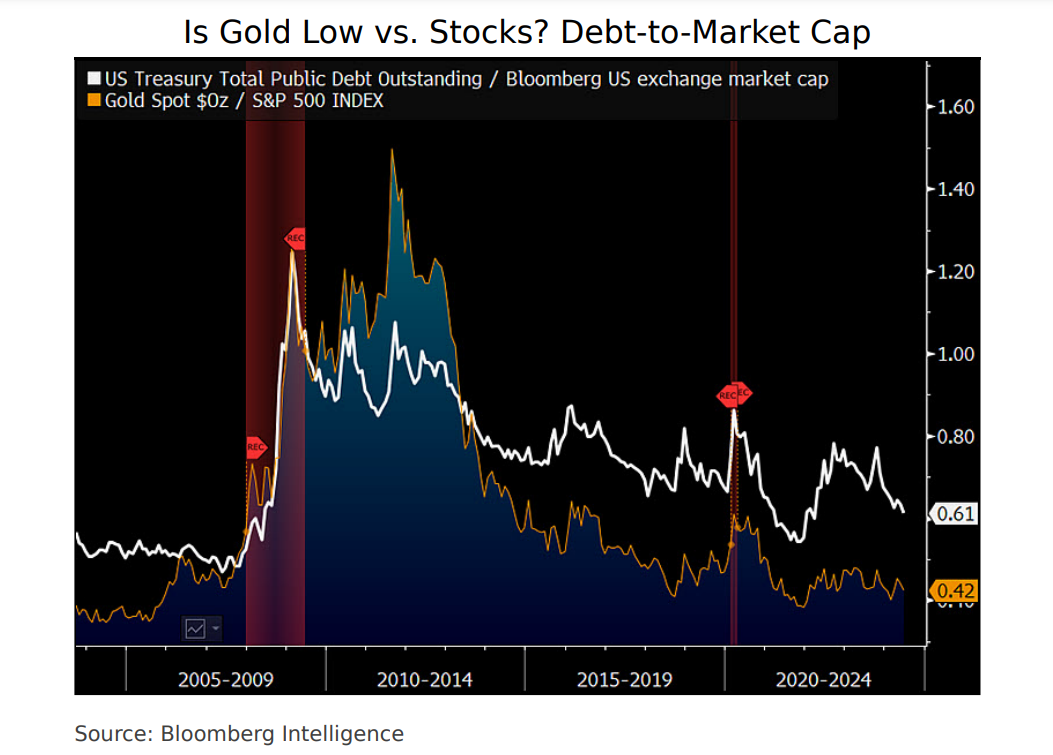
“Gold vs. the S&P 500 and US Treasury total public debt vs. stock-market capitalization on the same scale may show upside potential for the metal,” he wrote. “The ratio of ounces of gold to the S&P 500 (SPX) at 0.43 on June 24 is about the same as in 2007, just before the Great Recession. What's notable from our graphic is the debt-to-market capitalization ratio that was about 50% 17 years ago is 60% now. The propensity for debt to continue rising and a bit of overdue back-and-fill in elevated equities may be part of what gold's 13% gain in 2024 is sniffing out. Copper is up about 10%, but the spike to a new $5.20-a-pound high appears to have been fueled by speculative futures, with ephemeral and liquidation inklings. The total debt-to-market cap peaked at 1.35x in 2009, while Gold/SPX crested at almost 1.7x in 2011.”
On balance, Bloomberg Intelligence is forecasting a less uncertain second half of the year for gold prices, which they expect to continue rising.
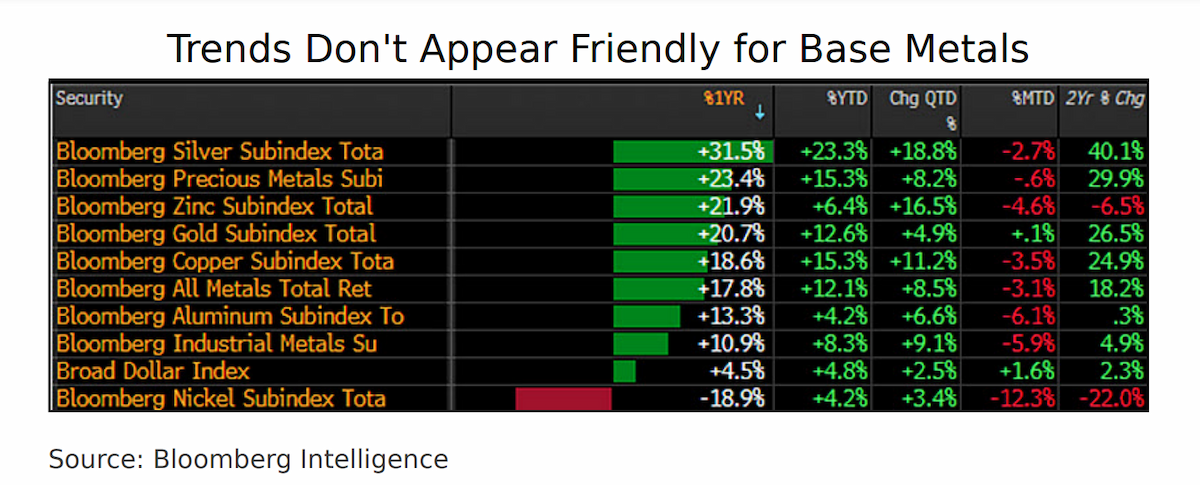
“Precious metals at the top of our annual performance scorecard and industrials on the bottom are trends that might accelerate in 2H,” McGlone said. “Despite the strong US dollar, advances in silver, gold, and copper could be a sign of divergent strength for the metals, though we see greater reversion risks for the base metals.”
He also pointed out that silver demand skews increasingly industrial, and the gray metal is being demonetized by gold. “Unless there's some unexpected detente in Cold War 2.0, we expect gold to be a top 2H performer,” he wrote. “A pullback in the US stock market may be a top risk to copper and base metals, and tailwind for gold.”
McGlone said that the decline in industrial metals prices relative to the gold price could accelerate if Chinese government bond (CGB) yields are any indication. “At 2.25% on June 18, the CGB 10-year suggests a new low in the ratio of the Bloomberg Industrial Metals Spot Subindex (BCOMIN) vs. gold,” he wrote. “At about 60, the BCOMIN/gold ratio is down from 100 at the end of 2009. The graphic shows the close link to CGBs.”
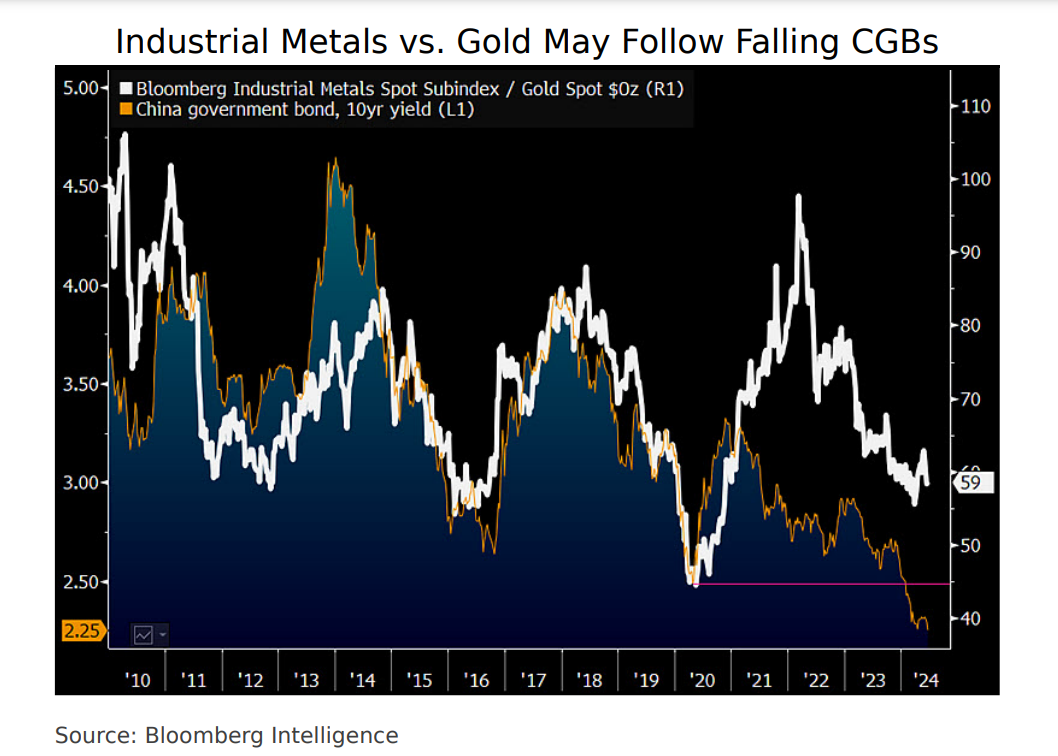
“Our takeaway is there may be little to stop the propensity for base metals to underperform precious metals, especially with CGBs showing deflationary recession inklings,” he said. “The Hang Seng index, at the lowest vs. the S&P 500 since 1975, may augur a top risk to the global economy – some back-and-fill in beta. The biggest money pump in history and Russia's invasion of Ukraine spiked the BCOMIN/gold ratio to the 2022 peak and the hangover could be enduring.”
McGlone also agrees with the prevailing view that gold prices will get a boost when the Federal Reserve begins lowering interest rates.
“Expectations for risk-asset underpinnings, on the back of the Fed eventually cutting rates, may follow the lessons of what markets widely anticipate not occurring -- with buoyancy implications for gold,” he wrote. “About 2.3 ounces of the metal equivalent to the S&P 500 (SPX) compares with the 1999 peak of 5.6 and 50-year average of 1.6. Our graphic shows SPX/gold on June 17 akin to the 2003 low.”
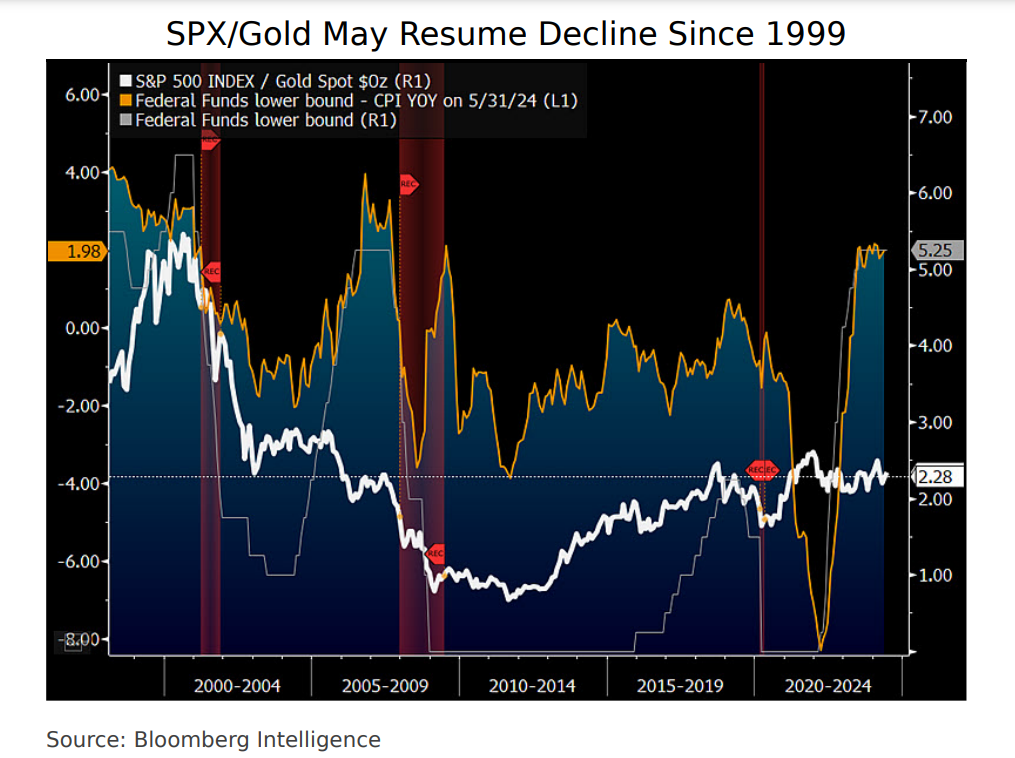
“A key question for 2H may be: Will the ratio recover or resume the downtrend from the peak 25 years ago? Our bias is the latter, and the central bank starting to cut could be a catalyst,” he said. “Gold has a history of outperforming when the SPX/gold ratio is above 2x and the Fed eases. At about 200 bps above the consumer price index, the funds rate is elevated, but so is the stock market vs. GDP and gold, which may be a top factor for sticky inflation.”
Bloomberg Intelligence is also forecasting gold prices to gain against silver after the gold/silver cross likely set a bottom last month.
“That the unemployment rate has never bottomed from a similar low as 3.4% in 2023 without surpassing 6% (since 1947) may buttress gold vs. silver,” McGlone said. “Our graphic shows the close connection between the precious-metal cross and jobless rate, especially when unemployment recovered akin to the pattern now.”
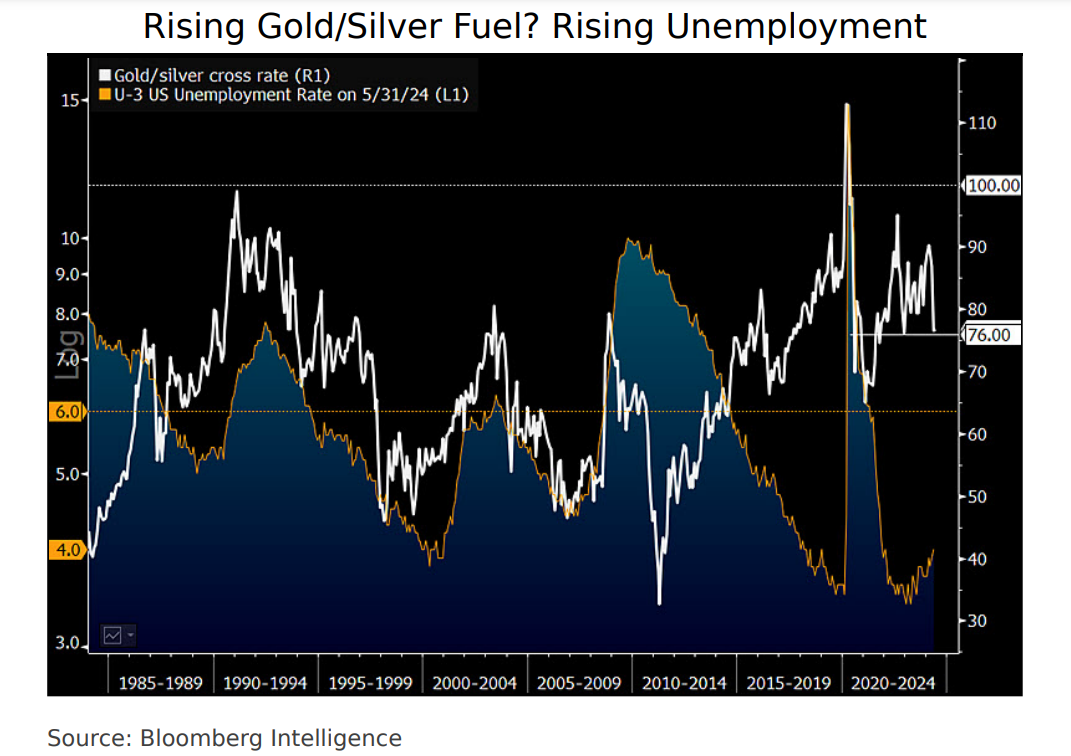
“The backup to 73 ounces of silver to gold in May – the lowest since 2021 – might have set a floor under the cross,” he added. “At about 77 on June 20, 73 looks like key support on the way toward the 1Q high just above 90.”
“What stops the gold/silver cross from rising with unemployment could be a top question for 2H – and our bias is little,” McGlone observed. “It's rare for the jobless rate to reverse course, and with the consumer price index year over year falling below rising unemployment for the first time since 1982, gold/silver tailwinds look strong.”