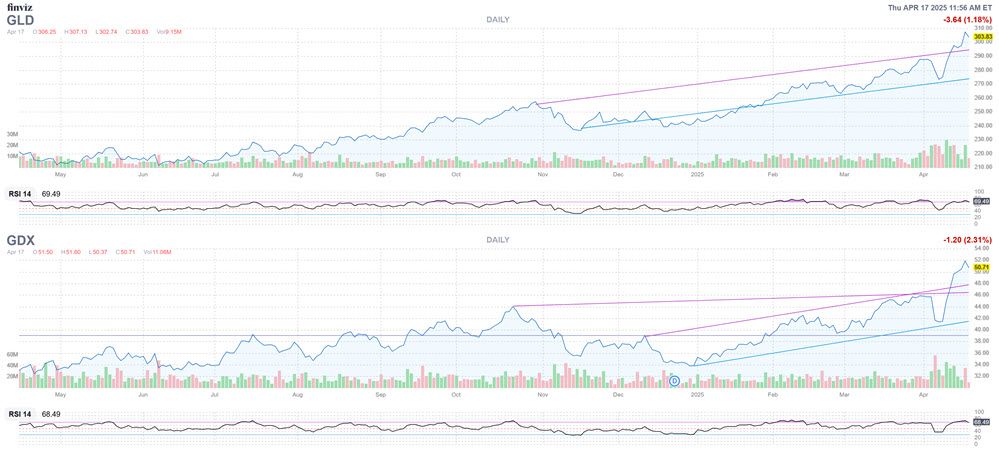
If you’re the type of trader that’s leery of trying to time a tech sector bottom, then you have probably already taken a flier on bullion. Gold prices hit a record high on Thursday after scoring a new 52-week high 24 times already in the last three months, per Bespoke Research. As noted in late February, gold mining stocks are along for the ride, the bond between the two even tighter amid rampant global uncertainty.
Spot gold exchange-traded fund (ETF) SPDR Gold Shares (GLD) hit a record high of $308.05 on Wednesday and is 27% higher year-to-date. Gold mining ETF VanEck Gold Miners (GDX) hit its own record high of $52.81 on Wednesday and is up over 53% in 2025. But with the initial shock of tariffs over, what is the short and long-term prognosis of the always-boring, but suddenly-popular safe-haven asset?
Both GLD and GDX have found themselves firmly in “overbought” territory amid the 2025 ascension, with their respective 14-Day Relative Strength Indexes (RSI) both comfortably above 70, at last check. Both ETFs have also seen an uptick in bearish bets in the options pits lately. At the International Securities Exchange (ISE), Cboe Options Exchange (CBOE), and NASDAQ OMX PHLX (PHLX), GLD and GDX’s respective 10-day put/call volume ratios of 1.01 and 2.02 sit in the 86th and 95th percentile of their annual range. With April expiration over, the most popular GLD contract is the May 275 put. For GDX, new positions are opening at the May 40- and 44-strike puts. Gold bulls could be contributing to this put-heavy activity, using options to hedge against any downside risk.
Two of GDX’s top holdings, Newmont Corporation (NYSE:NEM) and Agnico Eagle Mines Ltd (NYSE:AEM), have charts and RSI’s that mirror GDX, but the variable to monitor is that both companies report earnings this coming week. Newmont has a lackluster post-earnings history, finishing lower in five of its last eight post-earnings sessions, including a 5.7% drawdown in February. The company reports after the close next Wednesday, and the options market are pricing in 5.8% move, regardless of direction, which is slightly smaller than the average move of 6.9% in the last two years. Ahead of the event, the weekly 4/25 55-strike call is the most popular, but with the majority of the activity sell-to-open.
AEM’s post-earnings history is more varied. There’s the 4.9% gap lower on Feb. 14, but overall, the stock averages a post-earnings move of 2.3% -- regardless of direction – for the last eight reports. This time around though, the options market is pricing in a 6.1% move for Friday, with Agnico reporting after the close on Thursday. AEM has much less activity in its options pits, but new positions are opening at the May 150 call.
With tariff uncertainty starting to get baked into this earnings season’s slew of guidance and forecasts, a post-earnings stumble from NEM or AEM isn’t out of the question. Consider Taiwan Semiconductor from this past week; the chipmaker’s top-line beat, and reaffirmed guidance had the stock moving higher premarket, but once the bell rang and tech stocks sold off, TSM moved into the red several times during the day’s volatility. That’s the new reality for companies amid this tariff-driven uncertainty, and not even gold miners that have won the year so far are exempt from it.
Monitoring options activity this close to an earnings report comes with a caveat. Ahead of the known events, it's not surprising that NEM and AEM’s short-term options are fetching a pretty penny. Both NEM and AEM sport 30-day at-the-money implied volatilities (IV) in the 96th and 97th annual percentile, meaning near-term bets are pricing in higher-than-normal volatility expectations. As such, speculators betting on a near-term cooling off of gold may want to consider selling to open puts – as seen in the ETF activity above --instead of buying to open calls, or waiting to buy premium after earnings.
Even if there is a short-term breather looming, the long-term picture offers perspective. Per the chart below, both ETFs are above the upper rail of an uptrend channel from late 2024. The pullback would have to be pretty sharp and pretty sudden for the defensive asset to start testing key areas on the charts. If you’re a believer in corrections, there’s a case to be made, but longer term, there’s reason to believe the safe-haven asset can keep carving out new highs.