Silver has been a market that everyone has been talking about. How is it possible for Gold to trade north of $3000 and Silver not to be at $40 or $50 by now? Rather than writing a fundamental article discussing "why" precious metals are doing what they are doing, I find it equally important to analyze the technical chart patterns where proper recognition can help make trading decisions more straightforward. Technical analysis is both an art and a science. The key is recognizing these patterns while implementing a trading strategy on what you believe will happen
next. Staying ahead of the markets has never been easier. Get the Blue Line Futures Precious Metals Chart Pack today by registering here: Get Precious Metals Chart Pack
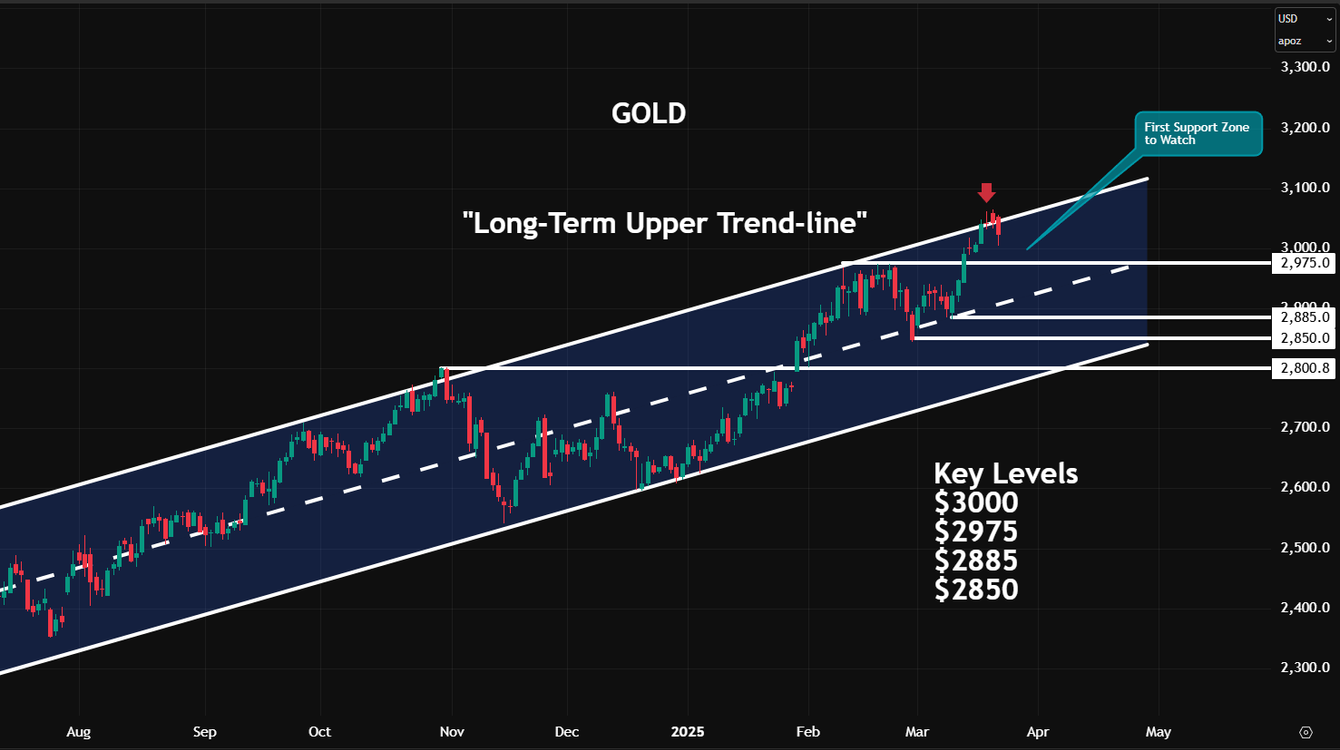
Daily Gold Chart
One of the first steps in becoming a master of the charts is to identify the trend. You probably know the classic adage: the trend is your friend, and there are dangers to fighting the trend. Gold futures began this latest leg higher in December 2023 after decisively breaking out over $2000, anticipating steadily declining global growth, sticky inflation, and a Federal Reserve on policy hold until further clarity is known.
When analyzing the daily Gold chart, two things come to mind. First, Gold has maintained its upper and lower channel boundaries for over a year. It becomes essential to recognize this pattern to help understand where Gold can go. Secondly, one must realize that there are areas of consolidation where support and resistance may form. Often, these areas become the optimal places for adding and reducing positions for risk management. I have identified four key levels for possible positioning in the above chart.
Daily Silver Chart
Silver has played "third fiddle" in the metals rally, with Gold and Copper stealing its thunder. After achieving $35 in mid-October 2024, Silver has consolidated in a sideways channel, leaving you with several areas of support and resistance before testing this level again earlier in the week. From my 25 years of experience in futures and commodities, I have learned that pullbacks are healthy in bull markets, and "double-tops," when broken, can lead to explosive rallies. A double top (two price peaks at similar levels) can signal a potential downtrend. When broken, a triple top (three peaks at similar levels) can become a strong bearish reversal pattern, indicating another leg higher. For those looking for "the story" behind Friday's selloff, I cover those types of moves in a daily video called the "Metals Minute." Register for a free two-week trial here: Get the Metals Minute.