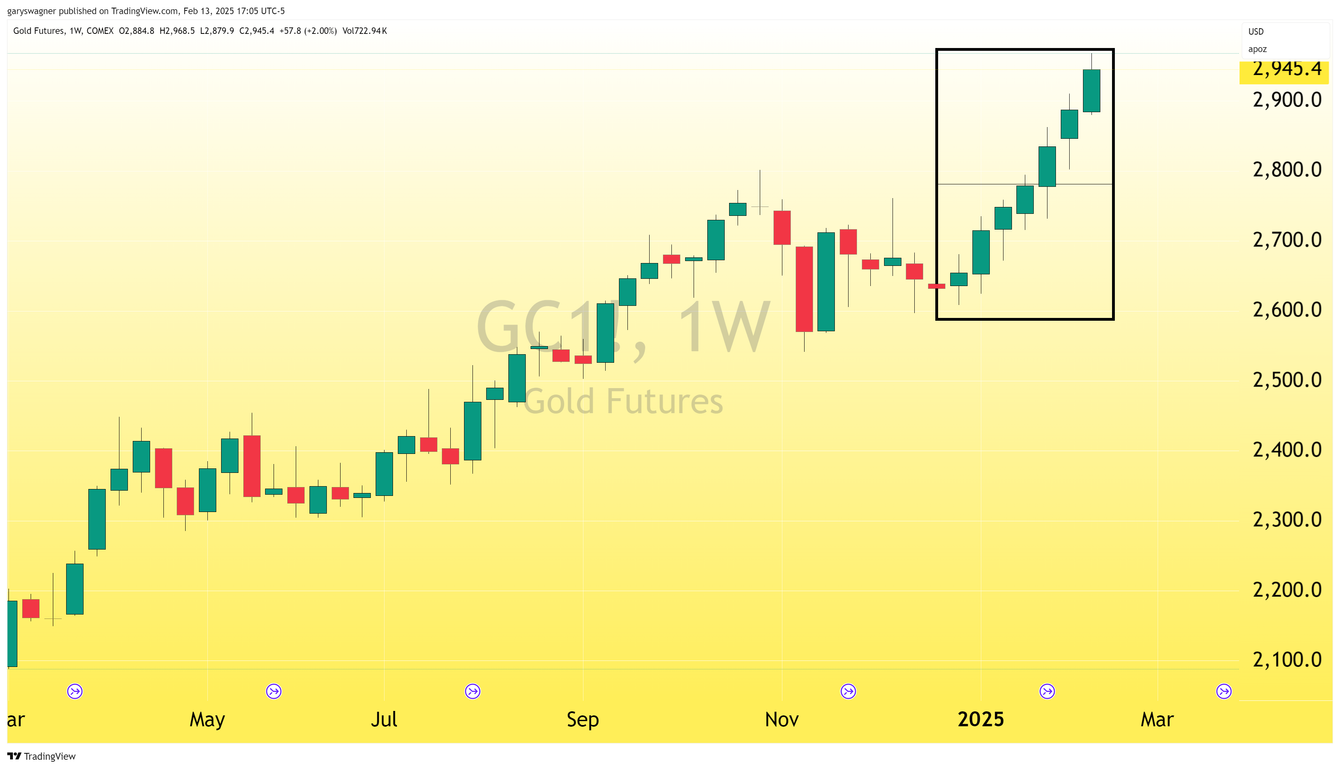
Gold surged to a new all-time record high today, with the most active April contract currently fixed at $2958.40, or 1.02% after factoring in net gain of $29.70. Dollar weakness was by far the largest contributor to gains in gold. The dollar index is currently fixed at 106.95, after factoring in today’s decline of 0.84%. Because gold is paired against the dollar when we subtract percentage gain in the dollar (0.84%) from today’s gain in gold (1.02%) traders accounted for only 0.18% of today’s record close.
Although it was dollar weakness that was the primary force moving gold higher, dollar weakness was the direct result of two factors; concern about tariffs, and January’s Producer Price Index report. Concern continues to grow following Trump’s, announcement to impose reciprocal tariffs on countries taxing US imports.
Today the government released the PPI index for January, revealing that producer prices increased 0.4% in January. Yesterday, the U.S. Bureau of Labor Statistics' released Januarys Consumer Price Index (CPI) report. That report revealed that inflation increased by 0.5%, surpassing both December's 0.4% rise and the
consensus forecast of 0.3%.
According to Reuters News, “U.S. producer prices increased solidly in January, offering more evidence inflation was picking up again and strengthening financial market views that the Federal Reserve would not be cutting interest rates before the second half of the year.”
Technical Analysis Reveals Rare Pattern
A remarkable technical pattern has emerged in gold's price action: seven consecutive weekly gains, represented by bullish (green) candlesticks beginning December 30. This rare occurrence has only one historical precedent in recent gold trading history, observed during the summer of 2011.
The chart above is a weekly Japanese candlestick chart of gold futures. The rectangular box highlights the last seven weeks and identifies an extremely rare pattern in gold, which I am labeling; “Seven Weekly Bullish Candles”. Beginning on Monday, December 30, the seven consecutive weeks have closed above its opening price creating seven consecutive green weekly candles.
The chart above is a weekly candlestick chart beginning in 2009. Historically speaking there is only one other instance when a weekly gold chart revealed seven consecutive weeks that gold closed above its opening price creating a (Green) bullish Japanese candlestick.
The chart above highlights the first occurrence of seven consecutive large green weekly candlesticks in gold. In seven consecutive weeks beginning on Monday, August 15, 2011. Over the next seven consecutive weeks gold would gain $395. Three weeks later in September 2011, gold would trade to an intraday high of $1923.70, creating a new record high above $1900 for the first time in history.
The parallel between these two seven-week bullish runs is striking, as both periods coincided with gold reaching record highs. Market participants should now closely monitor whether this current streak might similarly precede a price correction.
For those who want more information on our premium service, please click the link Premium Service
Wishing you, as always good trading,