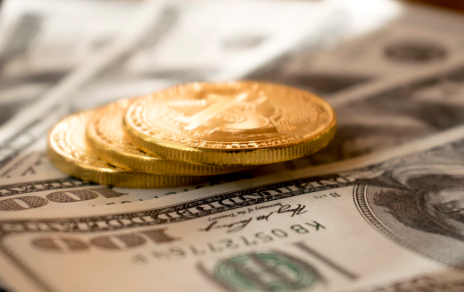
Another day, another all-time high for the gold price. Since the last week of March, Gold Futures have risen over $250 to move above $2400 as I type this column while trading up 11 of the past 13 Comex sessions. The safe-haven metal is rising sharply despite real yields and sticky inflation signaling “higher-for-longer” Fed policy interest rate expectations.
Gold continues to ignore the growing ranks of Federal Reserve officials saying there is no rush to cut interest rates, with still-too-hot-for-comfort U.S. inflation a rising concern at home and casting a shadow over expectations for policy easing abroad as well.
After the Swiss central bank became the first major institution to cut rates last month, traders for the most part have already factored in rate cuts by the Fed and European Central Bank (ECB) later this year.
The expectation of interest rates remaining higher in the short-to medium term has forced a breakout in the USDX above stiff resistance at 105 this week. Despite the 10-year U.S. Treasury yield also breaking out above resistance at 4.3%, both extreme overbought gold and silver weakness continues to see immediately willing buyers.
With the stock market beginning to show signs of topping, investors are waking up to the fact that the Federal Reserve is trapped between a weakening economy and its inflation-fighting mandate.
The gold price breaking out ahead of weakening equities, while both the U.S. dollar and bond yields continue to rise, shows a general loss of trust in the world's reserve currency as a store of value and U.S. Treasury bonds as a safe asset.
Gold's record run underscores investor concern that elevated inflation may persist, despite the Fed's policy efforts thus far. As long as economic uncertainties linger, the precious metal's status as a reliable store of value could continue driving prices into blue-sky territory.
Even as gold prices move to consecutive record-high closings, there is still considerable potential in bullion to continue climbing a wall of worry. Although the safe-haven metal is already up over 14% in 2024, bullion is still under-owned as Western investors have yet to arrive at the gold party.
When looking at this GLD fund flow chart, we are not even close to a parabolic move in gold. In fact, the last time ETFs added gold on net globally was October 2023, and that was a one-off event.
The World Gold Council (WGC) released its latest report on monthly ETF gold flows on Tuesday, which showed that global outflows dropped to their slowest rate since February 2020 and are 21% lower than the month-end record of 3,915t in October.
The analysts noted that North American-listed funds saw holdings increase by 4.8 tonnes, valued at $360 million. At the same time, Asia-listed funds saw their 13th consecutive month of inflows as holdings increased by 3.1 tonnes, valued at $217 million.
Although the gold market has begun to attract some North American investors, the gold-backed ETF market is in a deep hole as holdings are still down by 68.2 tonnes this year, valued at $4.3 billion.
“With gold reaching all-time highs, the default assumption for most would be that positioning is likely crowded, as it appeared to be in 2011, for example, but that is not the case,” WGC analysts said.
“When assessing gold ETFs as a percentage of total US ETF AUM we found their percentage share is at the fourth lowest level since inception. Similarly, we have found that open interest in the futures market resembles trends that we see across the ETF space; gold’s open interest is well below that of a set of futures across equities, bonds and commodities,” the analysts added.
With Western mainstream investors having yet to come into the gold space in size, record purchases of gold by Chinese citizens and central banks replacing U.S. dollars and other paper currencies for bullion at a record level has taken up the slack.
The ongoing global de-dollarization movement has been taking place since 2022, with central banks around the world continuing to accumulate gold at a record-breaking rate of over 1,000 tonnes for the 19th consecutive month.
Even with the gold price posting record highs for the past three consecutive quarters, there is no indication that central bank gold buying will slow down.
For central banks, unlike North American mainstream investors, the U.S. fiscal situation dictates immediate action. U.S. government debt continues to spiral higher, now adding $1 trillion more every 100 days with interest payments surpassing entitlements.
The U.S. monetary base just increased by $53 billion, up $575 billion since February 2023, during what is supposed to be one of the most restrictive monetary policies since the 1970s.
With ETF gold selling having recently slowed and a flip to buying recently taking place, along with continued robust central bank purchasing, we could begin to see a significant strain on the gold supply to drive prices even higher.
With no overhead resistance in the gold price, momentum hedge funds have been actively taking long positions in gold futures, further fueling the rally. Gold is extreme overbought and stretched far above its 50-day moving average, so prices are due for a pullback soon.
However, with risk now firmly to the upside after a confirmed major breakout above 4-year resistance at $2100, in robust bull markets prices persist higher despite overbought conditions.
After a technical breakout in gold was confirmed with a monthly/quarterly March close above $2100, this strong advance is set to continue with an initial 13-year cup & handle breakout target of $2500. The primary Fibonacci targets in gold are $2461 and $3336 based upon the depth of the 2011 to 2015 pullback.
Meanwhile, precious metals equities, which had been lagging the gold price for the past 4-years, still have plenty of catching up to do as they remain historically inexpensive.
Weakness in the mining space is being bought quickly now that momentum traders and hedge funds are coming into this relatively tiny sector following a major gold breakout to begin Q2, then silver clearing key overhead resistance at $26 last week.
The gold rush of 2024 is just getting underway and, if history is any guide, it may last at least 2–3 years. Historically, cyclical precious metals miner bull up-legs after a major breakout in gold, followed by silver, have lasted up to 3-years (2001-2003, 2005-2007, 2009-20011).
Since mainstream investors fled the junior space in 2013 en masse, there were two 6-month mini-miner bull markets in H1/2016 and H1/2020, which were subsequently followed by 4-year bear markets. The sector has been unloved, under-owned, and extremely depressed since the second one peaked in mid-2020.
But that is about to change. When the junior space comes alive, as it appears to be in the early stages of doing, the moves can be explosive. During the last 3-year mining cycle from 2009-2011, there were dozens of quality juniors that went up 5x-10x and several select silver juniors over 20x.
Now that gold has likely begun a major cyclical up-leg, junior risk has shifted to the upside after the mining sector pendulum has swung from long-term bearish to newly bullish.
After both GDX and GDXJ constructed solid 15-month bases, many junior gold and silver stock trains have been leaving the station one by one over the past several weeks. While both miner ETFs have become extreme overbought with the gold price, many swing-trader mining speculators are in the process of rotating miner profits into beaten down quality juniors on their respective watch-lists.
The Junior Miner Junky service provides complete transparency into my
trading activities and teaches investors how to navigate this high-risk/high-reward sector. Subscribers are provided a carefully thought-out rationale for buying individual junior stocks, as well as an equally calculated exit strategy.
If you require assistance in accumulating a basket of quality juniors with 3x-10x long-term upside potential, and would like to receive my research, newsletter, portfolio, watch list, and trade alerts, please click here for instant access.