Rethinking the Market Reaction to Tariffs
Bitcoin’s recent pullback has many traders panicking, but the broader reaction to tariff news may be overblown. Tariffs are nothing new—they’ve existed in the U.S. since 1790 and have been adjusted by every administration, including Biden's. So why is the market suddenly reacting so dramatically? The reality is that tariffs increase the cost of imported goods, which can contribute to inflation, but this isn't uncharted territory.
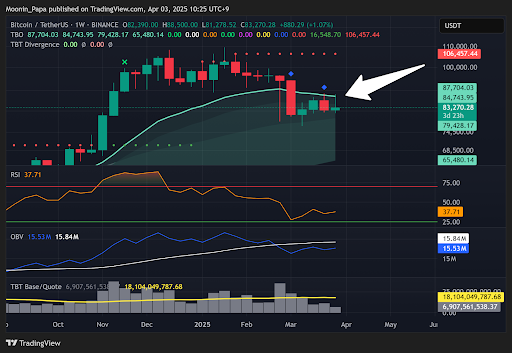
Instead, this feels more like a perfect opportunity for market makers to manipulate the crypto markets. Over the last month, BTC has remained within a 24% channel while most altcoins dumped significantly harder. This type of chop-solidation is classic during uncertain news cycles. What's more, BTC was climbing and piercing key resistance levels just before the latest dump. Even on this pullback, BTC didn’t make a lower low, which is quietly bullish.
BTC Showing Early Signs of Trend Reversal
Looking at the daily chart, BTC’s candle close yesterday came with a spike in volume that exceeded the 30-day moving average for the first time since March 11. OBV is flattening, and RSI put in a higher low. BTC even had a major pump inside the daily TBO Cloud—a sign of bullish consolidation returning.
Over the next seven days, BTC is expected to break above its topmost resistance line, close firmly inside the TBO Cloud, and eventually print a TBO Close Short on the daily chart. On the weekly chart, BTC wicked into the TBO Fast line again, reinforcing the potential for a push to $93k, where real resistance begins.
Dominance Charts Favor Altcoin Recovery
Stablecoin dominance spiked briefly but was rejected at previously broken support, now acting as resistance. This suggests stablecoin dominance may fall back into the daily TBO Cloud and continue lower—an encouraging sign for altcoins.
BTC.D has been on a multi-day run but now appears overextended. Daily RSI closed at 82.00, just shy of its previous high, hinting at a potential top. If it retraces to the daily TBO Fast line and breaks ascending support, this would favor a broader altcoin rebound.
Top 10 Dominance is putting in an RSI Reset after becoming oversold again, although the latest dip in RSI did break the February low. Meanwhile, OTHERS.D returned to TBO Support and is also showing an RSI Reset—another signal that altcoins are oversold and ready to rebound.
TOTAL and OTHERS Charts Still Show Strength
The TOTAL crypto market cap chart saw volume exceed its moving average two days in a row, a first since mid-March. OBV's white moving average is starting to curl upward, and RSI printed a higher low. Despite the rejection from overhead resistance, these signals suggest buyers are returning.
OTHERS charts show similar conditions: strong volume, OBV holding support, and multiple daily wicks to the TBO Fast line. While RSI did make a slightly lower low, this follows two days of bullish rejection wicks. Altcoins look increasingly ready to recover.
Watch OTHERS/BTC for Macro Reversal Signals
OTHERS/BTC, however, remains a key warning sign. The pair closed well below long-term support, which means trading BTC pairs is currently high risk. Historically, weekly RSI dropping to 19 or lower has been the best time to consider altcoin-to-BTC trades. Currently, RSI is at 26.71. Price-wise, the target remains around 0.10.
Volatility Is Returning as BVOL7D Climbs Higher
BVOL7D is halfway to the Rejection Zone, with daily RSI nearing overbought levels. The Bounce Zone called the recent shift in volatility perfectly. As BVOL7D continues higher, expect volatility to persist—especially for altcoins.
Select ALTs Flashing Bottom Signals
XRP, SOL, and ADA all appear short-term oversold with signs of strength. Volume spikes and OBV support suggest a bounce is likely over the next 7–10 days.
SUI continues to range tightly—ideal for active traders. LTC is showing multiple signs of reversal with RSI Resets and strong volume. HYPE, POL, and IP are all printing RSI Resets and seeing rising volume, setting up potential breakouts.
DEXE and KAVA, which saw dramatic one-day dumps, are beginning to recover. ZEC recently printed a TBO Open Long and shows solid indicator support. GRASS is printing a second TBO Close Short. PENDLE is also starting to shape up technically.
Final Thoughts
Despite fear-driven headlines and volatile price action, the underlying charts are pointing toward recovery. BTC remains in bullish consolidation, ETH is close to bottoming, and altcoins are showing oversold conditions across dominance and momentum indicators.
For those seeking to capitalize on the next phase of the crypto cycle, The Complete Cryptocurrency Investor at Mastering Assets provides the tools and insights needed to trade with confidence.