Bitcoin remains resilient even after Monday’s flash crash, which liquidated nearly $8 billion in leveraged positions. While many attributed the sell-off to Trump’s proposed tariffs, on-chain data suggests market makers and exchanges may have triggered the drop to capitalize on open interest. Despite the volatility, Bitcoin’s TBO Slow line continues moving upward, reinforcing the macro bullish trend.
Short-Term Resistance Remains a Challenge for BTC
Bitcoin's 4-hour chart shows continued consolidation below $106,000, a level that has proven difficult to break since January 20. While BTC remains strong, price action suggests a period of sideways movement similar to past post-crash recoveries. If BTC follows previous historical trends, it may consolidate before making a renewed push higher.
Ethereum Faces Relentless Selling Pressure
Ethereum continues to struggle despite a series of bullish developments, including ETF proposals. ETH’s recent underperformance has raised concerns about possible market manipulation, especially after World Liberty Financial moved $350 million in crypto to Coinbase. While WLF denied selling tokens, the timing remains suspicious. Adding to the confusion, Eric Trump posted that it was a "great time to add ETH," further fueling speculation.
Ethereum’s Oversold RSI Signals a Possible Reversal
Despite its recent struggles, Ethereum’s RSI has now entered oversold territory at 22.02, which historically signals a potential reversal. However, ETH remains far below the daily TBO Cloud, reinforcing the strong bearish trend. ETH must reclaim key resistance levels, particularly $3,014, before any meaningful recovery can take place.
Stablecoin Dominance Begins to Show Signs of Exhaustion
Monday’s panic pushed stablecoin dominance to 6.87%, a clear indicator of fear in the market. However, daily RSI failed to exceed its previous high of 77.71, signaling that stablecoin dominance may be peaking. If this trend continues, a pullback in stablecoin dominance could indicate renewed confidence in crypto markets.
Bitcoin Dominance Faces Major Resistance at 61.53%
Bitcoin Dominance continues to climb but may be approaching a turning point. BTC.D increased 0.52% yesterday, but RSI failed to surpass the January 29th high of 79.59. This suggests potential exhaustion, and a retracement to 59% over the next several days would provide relief for altcoins. On the weekly chart, BTC.D is facing resistance at 61.53%, a level that could mark a temporary top.
Altcoins Are Nearing a Critical Recovery Point
The OTHERS.D chart, tracking smaller-cap altcoins, remains extremely oversold but is stabilizing. Monday’s crash pushed OTHERS.D to 7.80%, a level not seen since June 2023. Despite this extreme sell-off, RSI remained above 25, indicating potential demand at these levels. The weekly TBO Support is still holding, which increases the probability of a reversal.
BVOL7D Indicates a Potential Relief Bounce for ALTs
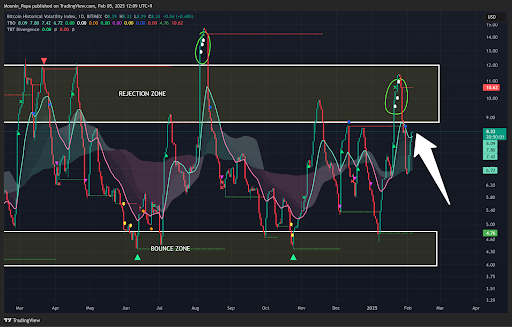
BVOL7D is now pulling back from its recent spike, a signal that altcoin volatility may be settling. Historically, when BVOL7D declines from these levels, altcoins tend to experience relief rallies. If this pattern holds, altcoins could see a strong recovery in the coming days.
Patience Pays: Market Shakeouts Create Opportunities
Despite this week’s volatility, the macro trend remains intact. Bitcoin’s price action remains strong, dominance metrics are signaling exhaustion, and altcoins are nearing critical reversal points. Historically, panic-driven shakeouts like Monday’s have provided some of the best long-term buying opportunities.