Bitcoin’s recent market activity has raised eyebrows, with the cryptocurrency printing a TBO Open Short on the 4-hour chart, typically signaling bearish sentiment. However, this could provide an opportunity for bullish indicators to emerge, such as a cluster of TBO Close Shorts ? or TBT Bullish Divergence signals. These patterns have historically been strong reversal indicators when Bitcoin is in a downtrend.
Several factors support the possibility of a bounce. On the 4-hour chart, RSI is holding steady along a key support line without making new lows, signaling resilience. Meanwhile, OBV is showing signs of recovery even as prices dip, hinting at potential divergence. Furthermore, Bitcoin’s price appears to be bouncing off a TBO Support zone, which aligns with a broader outlook for short-term strength.
The Critical $91K Support Level
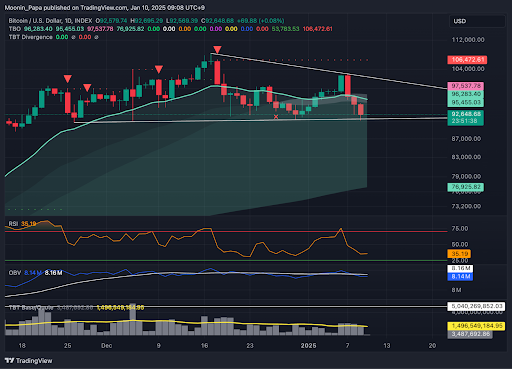
Bitcoin’s daily chart paints a precarious picture, with recent price action coming dangerously close to breaking key support at $91,000. A breach could lead to a significant drop, with a bearish Head & Shoulders pattern pointing to a target around $77,000. However, as of now, Bitcoin has maintained this support level, offering a glimmer of hope for a recovery.
Encouragingly, the daily TBO Slow Line remains angled upward, a hallmark of a strong macro uptrend. Despite bearish consolidation within the TBO Cloud, the absence of a new low on the daily close is a promising sign that Bitcoin may hold above this critical level.
Dominance Charts and Market Sentiment
Bitcoin dominance (BTC.D) is showing early signs of weakness, with daily RSI trending downward and price action struggling to maintain momentum. While another push toward overhead resistance is possible, it’s likely to face rejection, paving the way for a shift in favor of OTHERS.D. Historically, January has been a strong month for OTHERS, and the current CHMP analysis suggests that trend may continue.
OTHERS.D, while still lacking clear reversal signals on the daily chart, is exhibiting resilience on the 4-hour timeframe. With RSI recovering from oversold levels and price holding above the 0.786 Fibonacci Retracement level, a bullish recovery for altcoins may be on the horizon.
Stablecoin Dominance: A Key Worry
Stablecoin dominance remains the most concerning chart, with the daily time frame on the verge of printing a TBO Open Long. While this signal isn’t yet confirmed, its appearance could indicate growing caution in the market. Encouragingly, the daily TBO Slow Line continues to point downward, signaling a bearish macro trend. On the 4-hour chart, stablecoin dominance is struggling to break above resistance, further suggesting that its upward momentum may falter.
Ethereum and the “Reset” Effect
Ethereum’s daily chart is in the process of printing a TBO Open Short, which may seem bearish at first glance. However, this could serve as a “reset” for the TBO indicator, paving the way for TBO Close Shorts ? and bullish breakouts. A similar reset process has historically preceded strong bullish reversals, suggesting that Ethereum may be poised for recovery once the bearish chop subsides.
Weekend Pump Potential
Several charts hint at a potential weekend pump. OTHERS.D is holding above key support levels, with 4-hour RSI signaling recovery. OBV also shows signs of strength, supporting the idea of a broader market bounce. If Bitcoin maintains its $91,000 support and dominance shifts favorably toward OTHERS, the crypto market may see a renewed push higher in the coming days.